Chapter 4 | Reporting
Report Settings
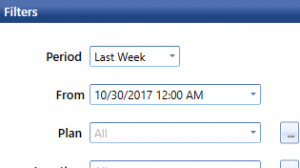
Here you can choose what will be in your report. By default All is chosen which means all plans, all users, all locations, etc. will be included in the reports data.
Checking the box Include Deleted Rows will include deleted results in the report.
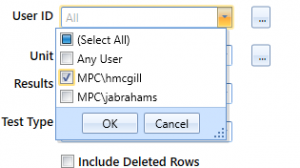
Clicking on any of the fields will allow you to pick and choose what data will appear in your reports. For example, you can specify specific plans, locations, users, or even units to include in your reports if you do not want to include all.

You can save your entered information if this is a report you conduct often by clicking the floppy disc icon.
Pressing the star will allow you to add this report to your Favorites list. Clicking the gear icon will allow you to save and customize this report.
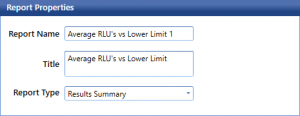
This panel is only available when working with a saved or custom report.
You can change the report name that appears in the Customized Reports list and choose a Title that will appear at the top of the report.
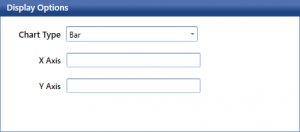
This panel is only available when working with a saved or custom report.
Select the type of chart you want your report to include. You can select from a variety of bar, line, point and pie charts. You may also edit the axis text.
This panel is only available when working with a saved or custom report.
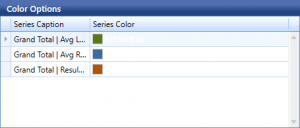
Select the color(s) you want to appear in your report charts, graphs, or tables.