Floor Plans
Floor Plans in SureTrend Cloud
This feature of SureTrend Cloud allows you to upload a floor plan of your facility and drag pinpoints of testing locations onto the map. After testing is performed you can view a heatmap of their failures. Only Owners or Admins can upload maps so ensure that you’re logged in as a user with one of these roles before you get started.
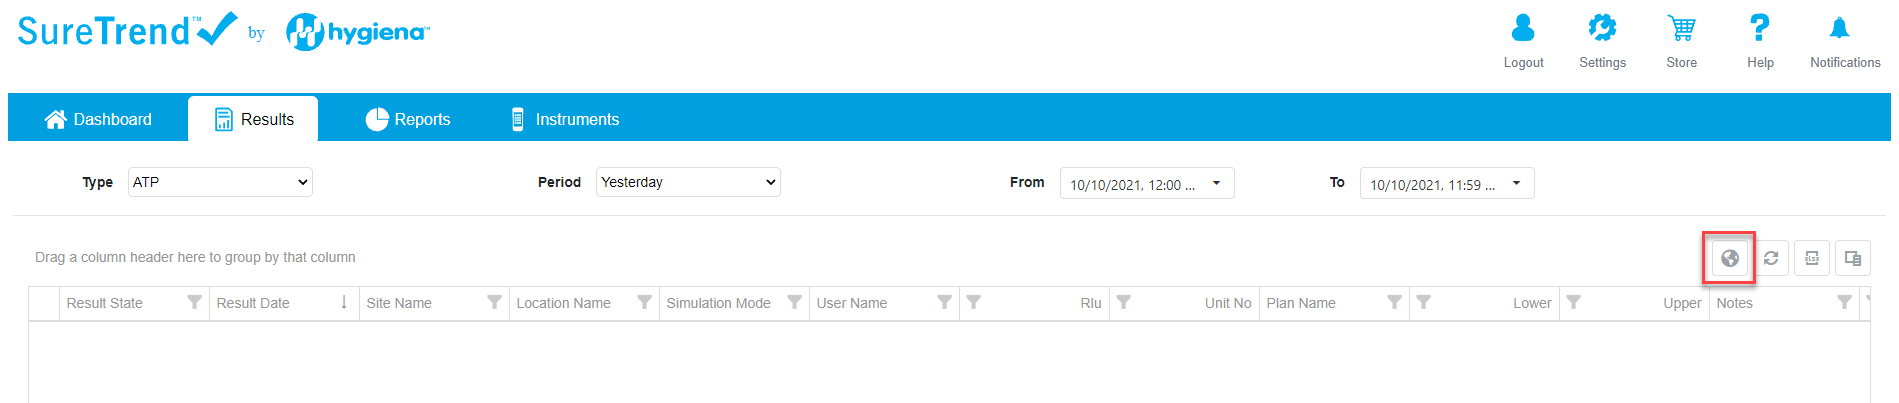
- From the Results, tab click on the Globe Icon as shown in the screenshot below
- You will be presented with the following screen.
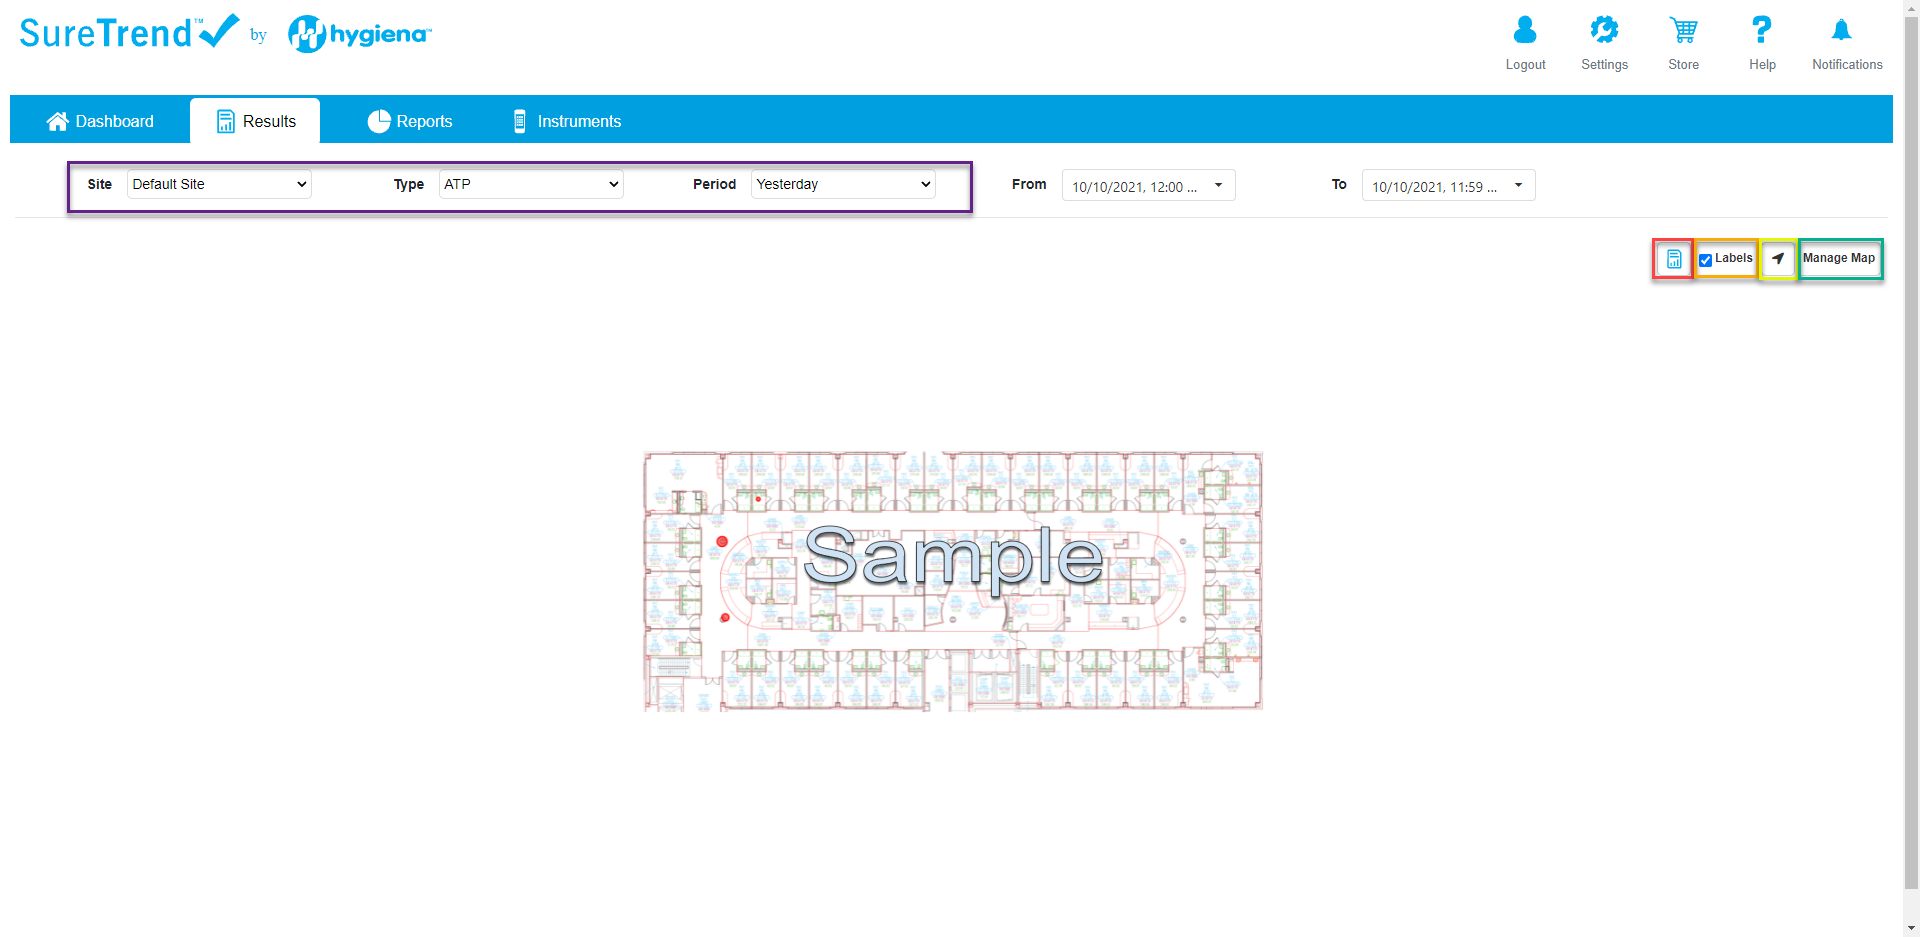
a. Purple Box: these are your filters. Please ensure that you have the right site selected. If the screen is blank it is because the filters you have selected don’t have any data. Try changing Type to ATP and change the Period to a timeframe for which you are certain that there test results.
b. Red Box: this will take you back to the classic Results
c. Orange Box: this will allow you to hide/show the location names on your map.
d. Yellow Box: this will allow you to recenter the map if you’ve dragged it or zoomed in.
e. Green Box: this will allow you to upload a floor plan to a site. - Click Manage Map and then you’ll be taken to this screen to upload a floor plan using the buttons in the purple box below.
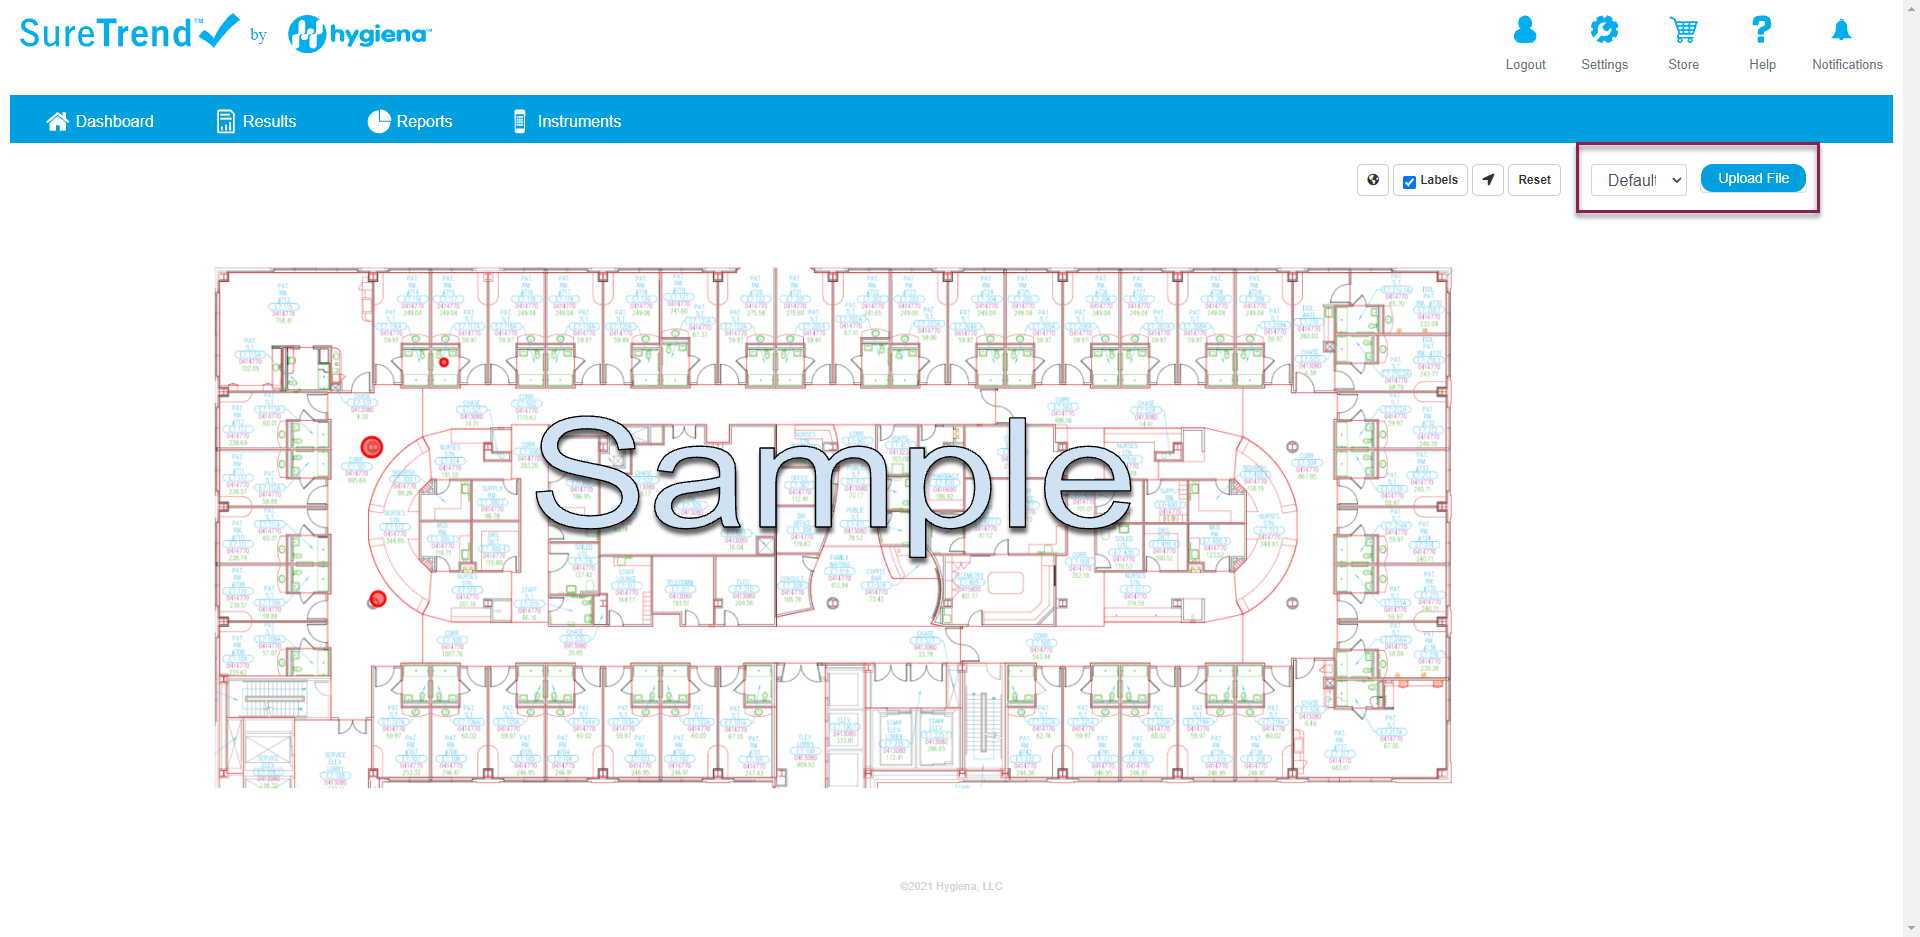
- Select the file you would like to upload. Currently, only .svg files are accepted. If your file is in another format (.jpg, .png, etc.) you can convert it online.
- After you select your file, you’ll see the file name next to the button. Now, click the Upload File
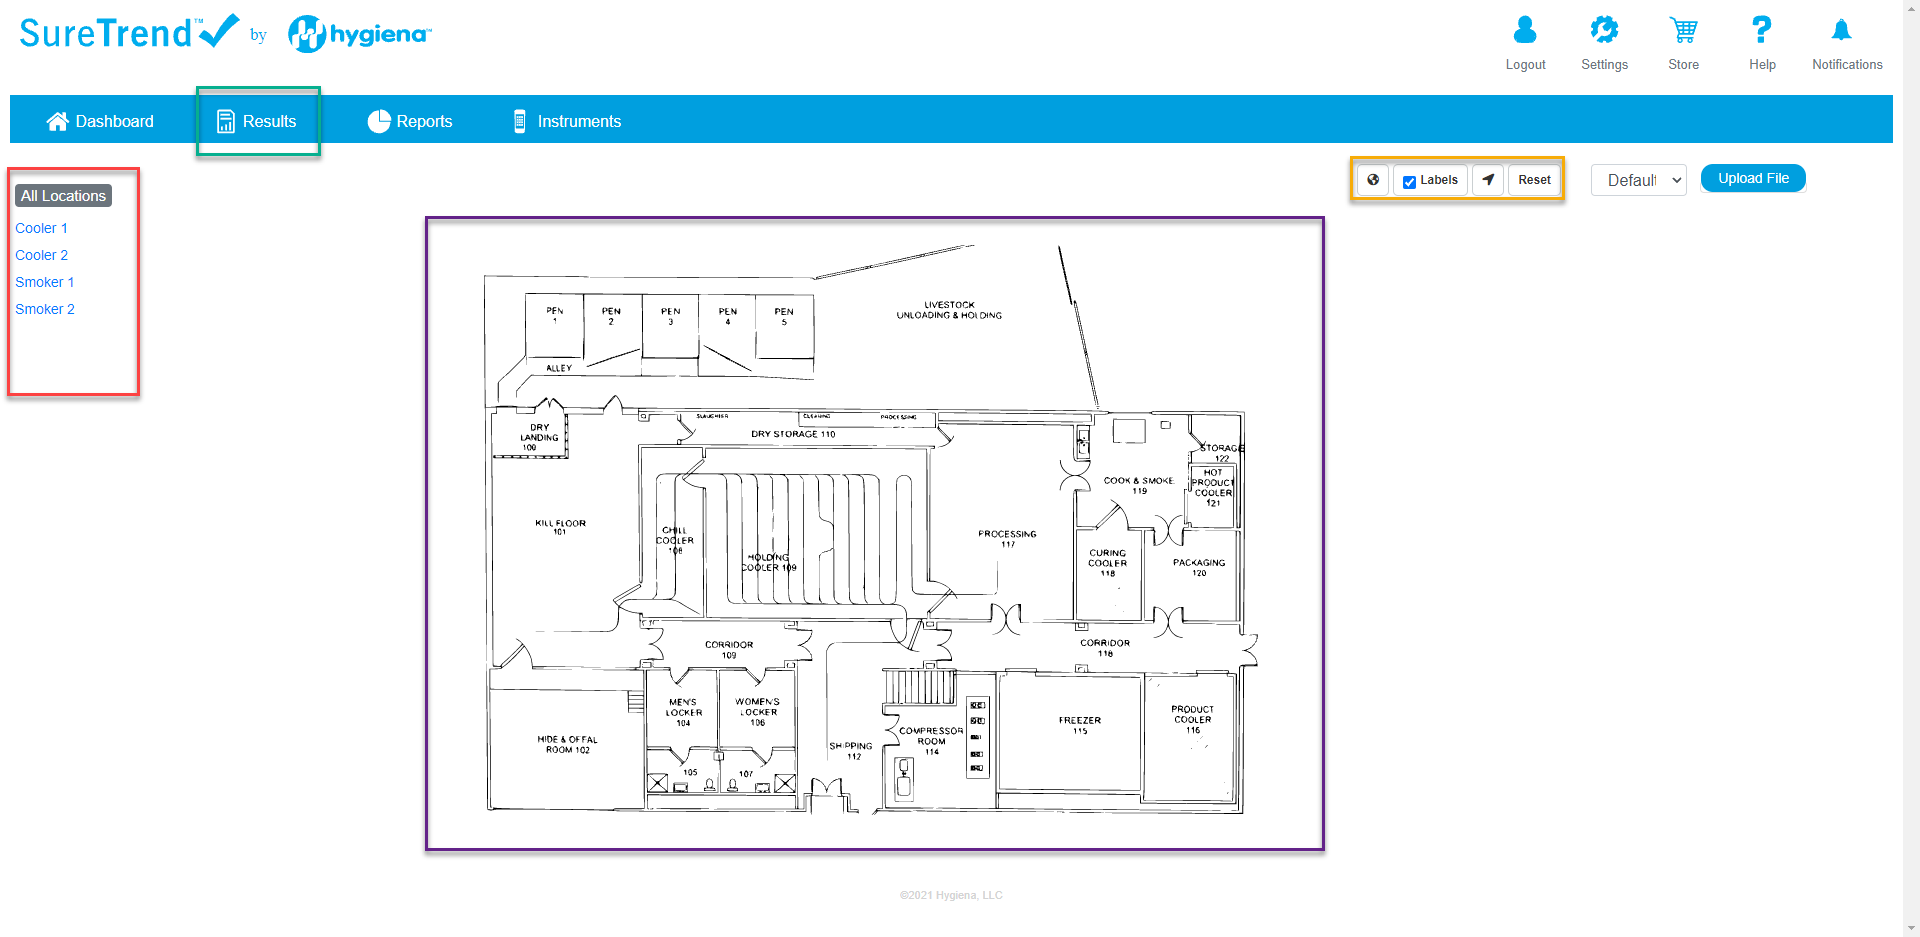
a. Purple Box: this is your floor plan. You can zoom in and drag the map around to get a closer look at areas in your facility. If you need to recenter the map, click the Recenter button in the orange box.
b. Red Box: this is where you will see a list of your locations. You can drag these locations over to your floor plan to assign them to that spot on the map.
c. Orange Box: this contains a few key buttons that will allow you to manipulate the map. See step 2 above for details.
d. Green Box: If you want to return to the Results page, click here. - After setting up your locations on the floor plan, you’ll be able to see a heatmap of failures on the map. If you hover over the location you can see how many failures it has for the period selected. Don’t forget to use the filters and buttons in the red boxes below.