Reports
Reports in SureTrend Cloud
To make it easy to track environmental monitoring and sanitation effectiveness – whether for one facility or hundreds – SureTrend Cloud has advanced reporting features. To view reports, go here: https://suretrend.hygiena.com/#!/reports
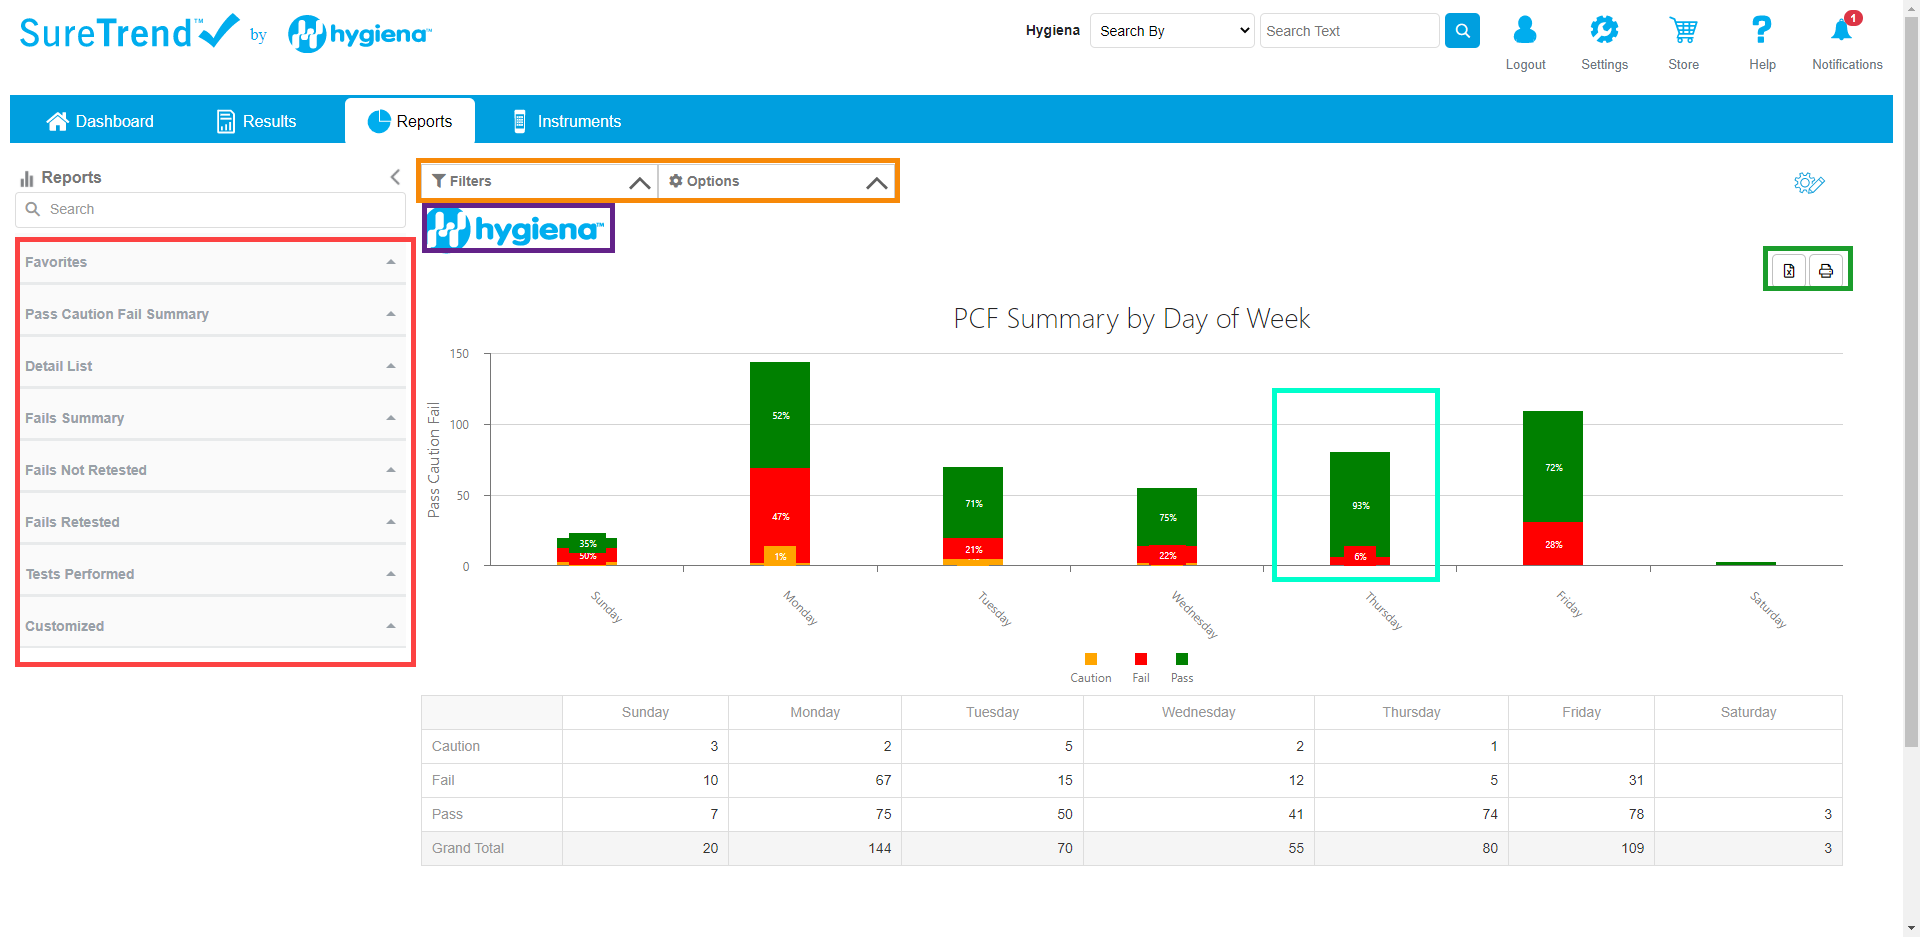
Red Box: These are your reports. You can use the search bar to search for a report or use the drop-down arrows on the right to expand each report category. The arrow at the top right corner of the red box will expand/collapse the list of reports in case you want extra room for viewing the chart on the report on the right.
Orange Box: These are your filters and options. When you select a report, make sure you open your filter & option menu to select the correct date range and filtering options.
Green Box: This button allows you to print/export the chart & table for your records.
Teal Box: When you hover over your chart, addtional data will appear such as what is shown in the teal box.
Purple Box: This is where your company logo will be displayed if you choose to upload one. It will also be shown on printed/exported reports.
Magenta Box: The first button in the magenta box will open an advanced field choser that works just like Excel Pivot Tables. The second button will export your report data to an Excel file.
SureTrend Cloud Report Filters
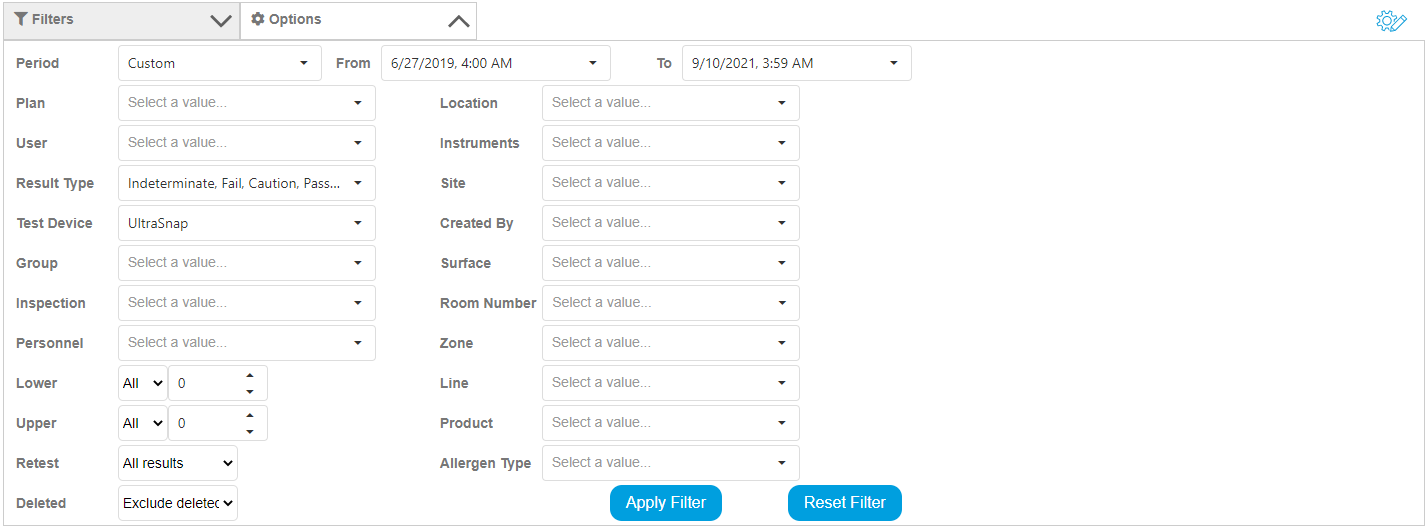
- Period refers to the time period during which you’d like to view data from. You can use this to easily select time periods such as ”this week”, ”last week”, ”last month”, or ”last year.”
- From & To are used to select a custom date range other than what is offered in the Period drop-down.
- Plan allows you to filter results by one or more plans.
- User allows you to filter by user. This refers to the EnSURE Touch user (not the SureTrend Cloud user) which means the person who performed the testing.
- Result type allows you to choose which types of results you’d like to include in the report. If you check the pass & fail boxes but leave the caution unchecked then caution results will be excluded from your report.
- If you check the Deleted box then your report will include results which were ”deleted” or hidden. Results are usually deleted if they were performed by mistake, for example if you were to run a test on EnSURE Touch but you forgot to activate the swab. For auditing purposes and to prevent data loss, results are never actually deleted from your account.
- Location allows you to filter results by one or more locations.
- Instrument allows you to choose which instruments are included in the report
- Site allows you to choose which sites are included in the report.
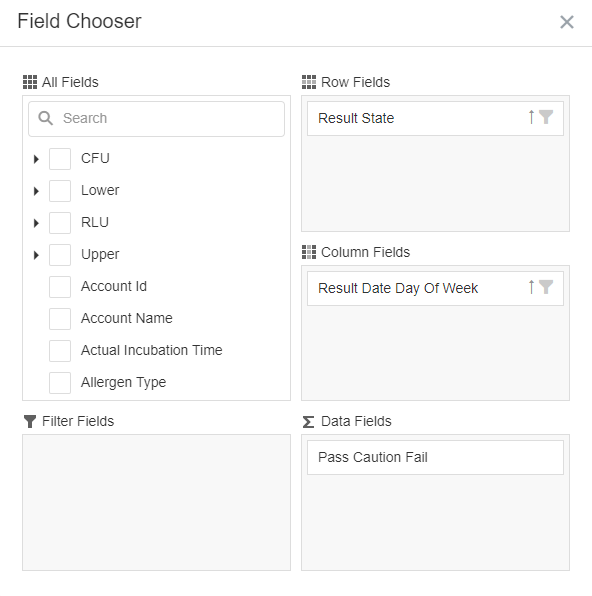
Advanced Filtering with the Field Chooser
If you click the Field Chooser button you will see the following options appear. It functions similarly to an Excel Pivot Table.
SureTrend Cloud Report Options
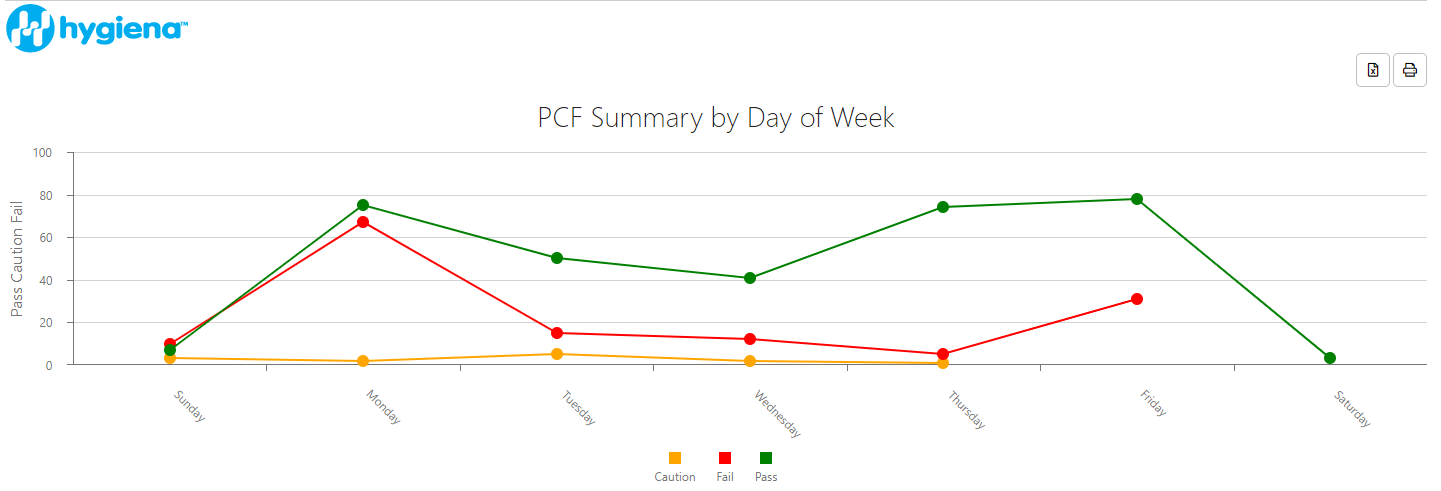
The options menu lets you choose which type of graph you’d like to use for your report.
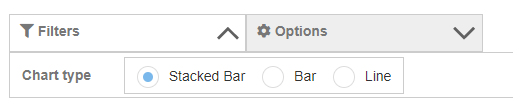
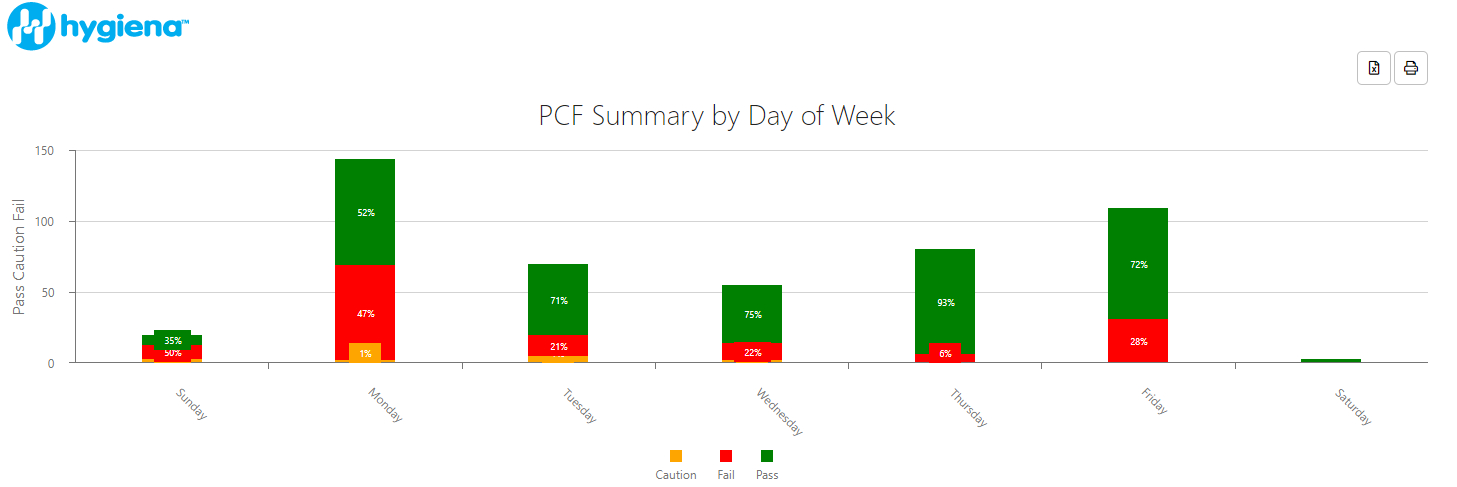
Stacked Bar
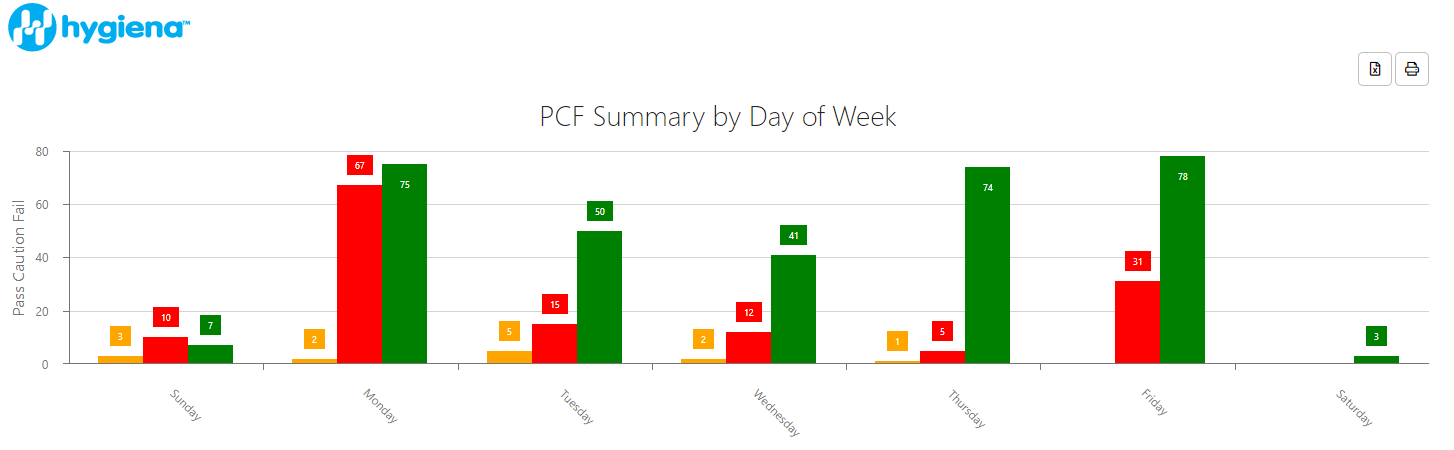
Bar
Line